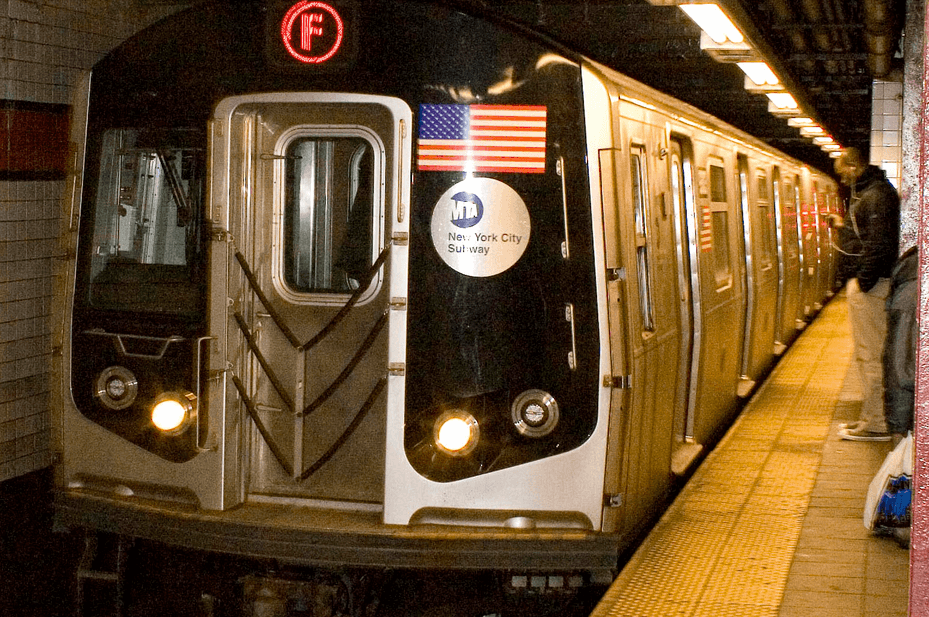
F Train Claims Title For Subway Line With The Most Delays
The F train is not having a good week at all. Just this past Thursday, a Brooklyn-bound F train derailed while working its way through Queens (luckily, no one was killed) and in a few short months, the line will undergo major Hurricane Sandy-related shutdowns.
Now, the MTA truthers at NYPIRG’s Straphangers Campaign have exposed yet another blemish on the F train’s permanent record: It’s the subway system’s most delayed train line.
According to a new report from the organization, which purposely ignored data from Hurricane Sandy-ravaged 2012, preventable “delay-generating incidents” increased systemwide by 35 percent between 2011 (2,967 incidents) and 2013 (3,998 incidents). The majority of those delays–8 percent–occurred along the F train line.
And yet, the staggering number of F train delays might not be the worst part of the report. The Campaign also shared this depressing nugget of information: “The L worsened the most — by 91% — from 96 MTA alerts of delays in 2011 to 183 alerts in 2013.” Meanwhile, the J/Z line, which runs from the Financial District to Jamaica, Queens, experienced the least amount of delays and was the only subway line to experience a decrease in delays since 2011.
The report concluded that the majority of delays were caused by “mechanical problems,” followed closely by “signal” problems, which the Straphangers Campaign claims is “a troubling sign that subway service is deteriorating.”
Never one to lose face, the MTA had this to say about the troubling numbers:
Since 2011, the amount of time customers have had to wait for a train throughout the system has remained flat. We agree that the service alerts are a powerful tool that deliver meaningful information to customers. We have increased staff and have become more efficient in providing service information in a more timely manner so customers are quickly aware of any incidents that may impact their commute. However, the cause of such incidents can quickly change upon further investigation which is why the alerts were never meant to serve as a performance metric. Our wait assessment metric, which includes BOTH controllable and non-controllable incidents and measures the amount of time customers have had to wait for a train , provides a more comprehensive picture of service quality. Despite increased ridership and the challenges we face with these incidents, we continue to develop and deploy strategies to maintain even intervals of service for our customers, and our wait assessment metric reflects this focus. Again, since 2011, the amount of time customers have had to wait for a train throughout the system has remained flat.
We’re not so sure about all that, but we will say that if you’re going to write a scathing letter to anyone about these issues, it should probably be the man who recently diverted $30 million dollars away from the MTA earlier this year.
Follow Nikita Richardson on Twitter @nikitarbk